Overall Viewer Experience
Overall Viewer Experience is a high-level score from 0 to 100 that measures the QoE (Quality of Experience).
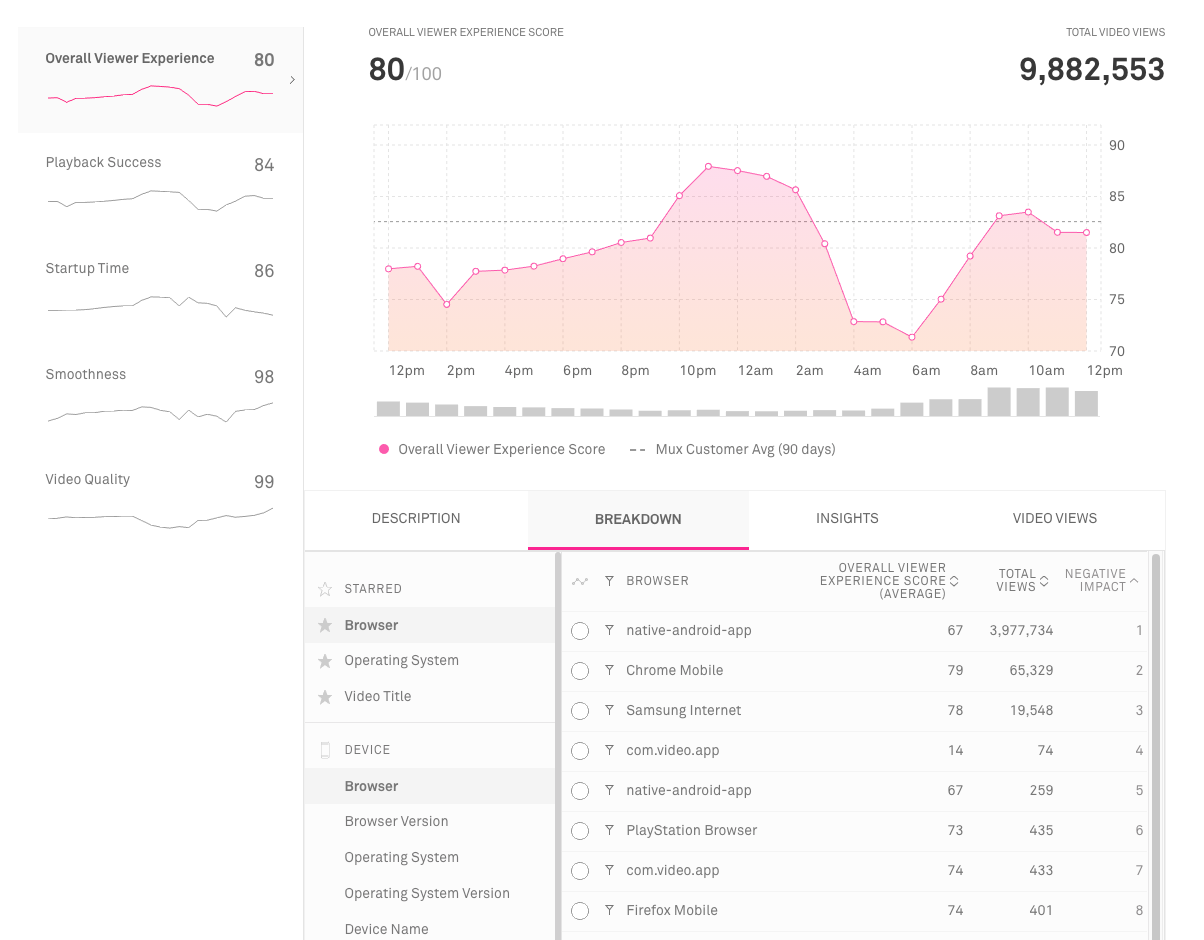
Overall Viewer Experience Score
Overall Viewer Experience Score is a metric that describes the overall Quality of Experience (QoE) of video streaming in a single number. A score of 100 means every viewer had a satisfying experience, and a score of 0 means that every viewer had a frustrating experience.
Overall Viewer Experience Score is based on four other Viewer Experience Scores, which each describe one of the four elements of video streaming performance: Playback Success, Startup Time, Playback Smoothness, and Video Quality.
Viewer Experience Scores are useful as a way to describe streaming performance from the perspective of an end viewer and not just from the perspective of system-level metrics. The Viewer Experience Scores are QoE (Quality of Experience) metrics, which describe the actual end-user experience of watching video. This is in contrast to QoS (Quality of Service) metrics, which describe a specific system’s performance without reference to user experience.
For example, "Downscaling Percentage" is a useful metric to track when it comes to QoS, since a high Downscaling Percentage means a service is delivering more video than necessary to fill the player or display. But users don't see downscaling, so Downscaling Percentage doesn't come into QoE when describing video quality. However Upscaling Percentage is a QoE metric because upscaling creates visual artifacts in the video, affecting the viewer’s experience.
Both QoE and QoS metrics are important for different purposes. QoS metrics are useful when troubleshooting specific system problems, while QoE metrics are useful when evaluating technologies or prioritizing problems to improve.
Formula
Each individual video view is given an experience score of 0-100, and the Overall Viewer Experience Score is calculated by averaging the experience of all video views. Each view’s experience score is measured by first calculating a score between 0 and 100 for each of the elements of streaming performance (Playback Success, Smoothness, Startup Time, and Quality). Those scores are then averaged using higher weights for the more impactful elements of the viewer experience.
The weights are created by measuring the relative importance of each element of the experience. Mux conducted user surveys and research across millions of video views on the relative tradeoffs between increasing one metric at the expense of another. For example, you can increase Quality at the expense of Startup Time and vice versa. However, doing so would be a bad idea because Startup Time is more valuable than Quality. Generally, we found that Playback Success is the most important, followed by Smoothness then Startup Time, and finally Quality.
We want to make sure the Overall Score captures these complex relationships between metrics since developers may decide to make certain tradeoffs in order to improve their QoE scores. So, instead of just averaging the scores, Mux creates a set of tradeoff scores first and combines that into the overall score. The exception is Playback Success, which is a multiplier applied to the Overall Score.
The Overall Viewer Experience Score is defined as:
where
This way of combining the metrics is a more accurate representation of the viewer’s quality of experience, and increases the usefulness of Mux Data’s scoring system.
Use this metric to:
- See trends in your overall viewer experience over time
- Begin prioritizing your efforts in areas of your platform (devices, regions, etc.) that have the lowest score and can use the most improvement