Set up alerts
Set up alerts so your team can be notified when certain conditions occur on your video platform.
In this guide:
Define terms
Rule: Criteria for when an alert should be triggered based on a metric, threshold, and filter criteria.
Incident: A specific instance when the conditions of an alert Rule are met and an alert is triggered.
Start Time: The timestamp of when a metric initially crosses over an alert rule threshold.
End Time: The timestamp of when a metric crosses out of an alert rule threshold.
Trigger Interval: The time period from when a metric initially crosses over an alert rule threshold to when an alert incident notification occurs.
Resolution Interval: The time period from when a metric crosses out of an alert rule threshold to when an alert incident notification occurs.
Incident Duration: The total length of time spent in an incident, from the start of the open interval to the start of the close interval.
Alert rules
There are two types of alerts supported by Mux Data: Anomaly and Threshold.
Anomaly alerts are configured automatically based on the historical failure rate of views in the organization.
Threshold alerts allow you to define specific criteria for viewer experience metrics that will trigger notifications.
Anomaly Alerts
Anomaly alerts are generated when failures are elevated over a historical level. The historical level is determined by measuring the overall failure rate of videos in each organization over the recent past using a moving window.
There are two levels of playback failures that are used for anomaly detection:
- Organization-wide: The failure rate is calculated using all video views that are tracked within the organization.
- Per Video Title: The failure rates are calculated using the video views of every video title tracked within each environment separately.
To determine whether failure rates are elevated, the anomaly detector groups the on-going views in buckets ordered by time and compares the failure rate of each bucket to the historical organization-wide failure rate. If the failure rate of the bucket of views is determined to be an extreme outlier the failed views will be flagged as anomalous, and an incident will be opened.
The bucket sizes are based on the anomaly alert level:
- Organization-wide: 1000 views
- Per Video Title: 100 views for each video title
The outlier determinations are set dynamically based on your historical values so there is no need for configuring the specific thresholds in the anomaly alerts.
Anomaly alert incidents are automatically closed when the error-rate returns to normal levels. An incident for a video title or organization that hasn't received views in the last 8 days will be marked as expired.
Threshold Alerts
Threshold Alerts are only available on Mux Data Media plans.
Threshold alerts allow you to define specific criteria for alerts that will trigger incident notifications.
Alert rules can be created for metrics collected in the Monitoring Dashboard:
- Failures
- Rebuffering Percentage
- Video Start Time
- Concurrent Viewers

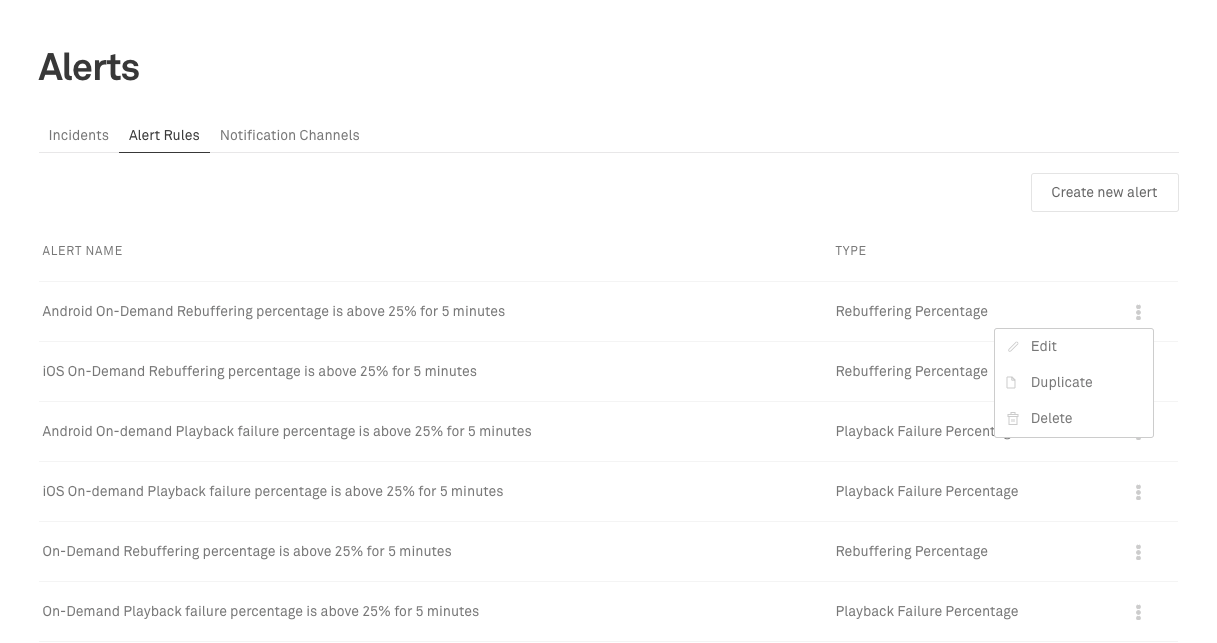
From the menu on the right of list item on the Alert Rules list page, the following actions can be taken:
- Edit
- Duplicate
- Delete
Filters
Filters are applied to the alert definition to track only the specific data you want considered for the alert. Data for alert rules can be included or excluded from the following dimensions:
- ASN
- CDN
- Country
- Mux Asset ID
- Mux Live Stream ID
- Mux Playback ID
- Operating System
- Player Name
- Region / State
- Stream Type
- Sub Property ID
- Video Series
- Video Title
Value ("trigger if")
The threshold value the metric must cross for the alert condition to be met.
Above/Below ("rises above/falls below")
For alerts specified with the Concurrent Viewers metric, the criteria can be specified to trigger when the metric is above or below a threshold. Other metrics are specified to trigger when the metric is above the threshold.
Alert Interval ("for at least X minutes")
The amount of time the threshold criteria needs to be met in order to open or close an alert incident. The interval length can be set between 1 and 60 minutes.
Minimum Audience ("with a minimum audience of X average concurrent views")
The average number of concurrent viewers must be over the specified value in order to enter or exit an alert incident.
If the number of concurrent viewers falls below the specified minimum audience during an alert incident the incident will continue. The number of concurrent viewers needs to be over the minimum audience in order to for the alert incident to close.
Note: If a rule definition is changed, any open incident based on that rule is automatically closed. A new incident will be opened after the alert interval time if the updated rule criteria is met.
Manage incidents
Listing Incidents
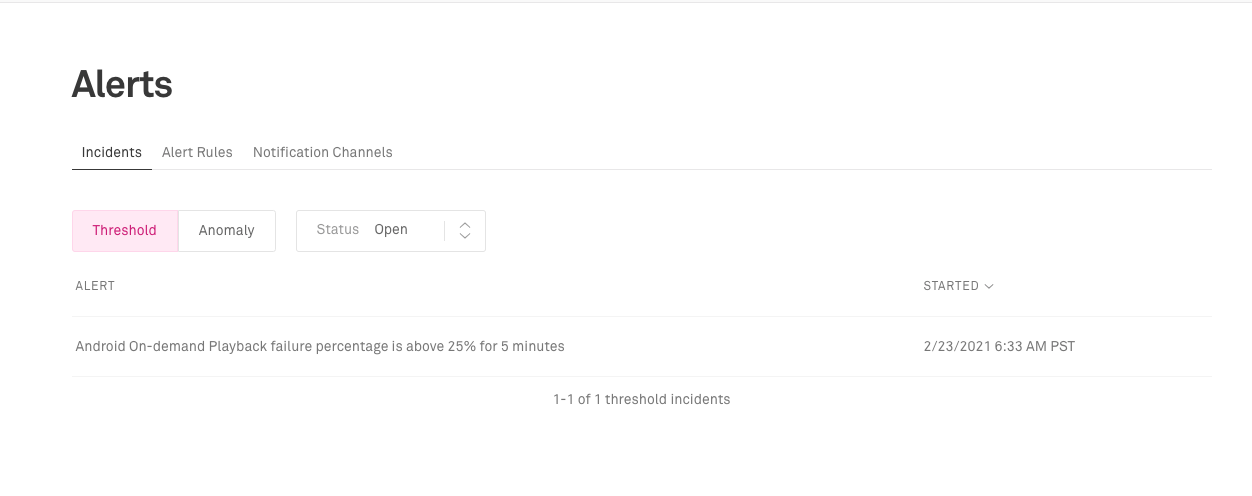
When Anomaly and Threshold alert incidents are generated, they are listed in the "Incidents" tab.
You can choose the type of alert in the list:
- Threshold
- Anomaly
By default, currently "Open" issues are shown but all historical issues can be viewed by choosing "All".

Incidents
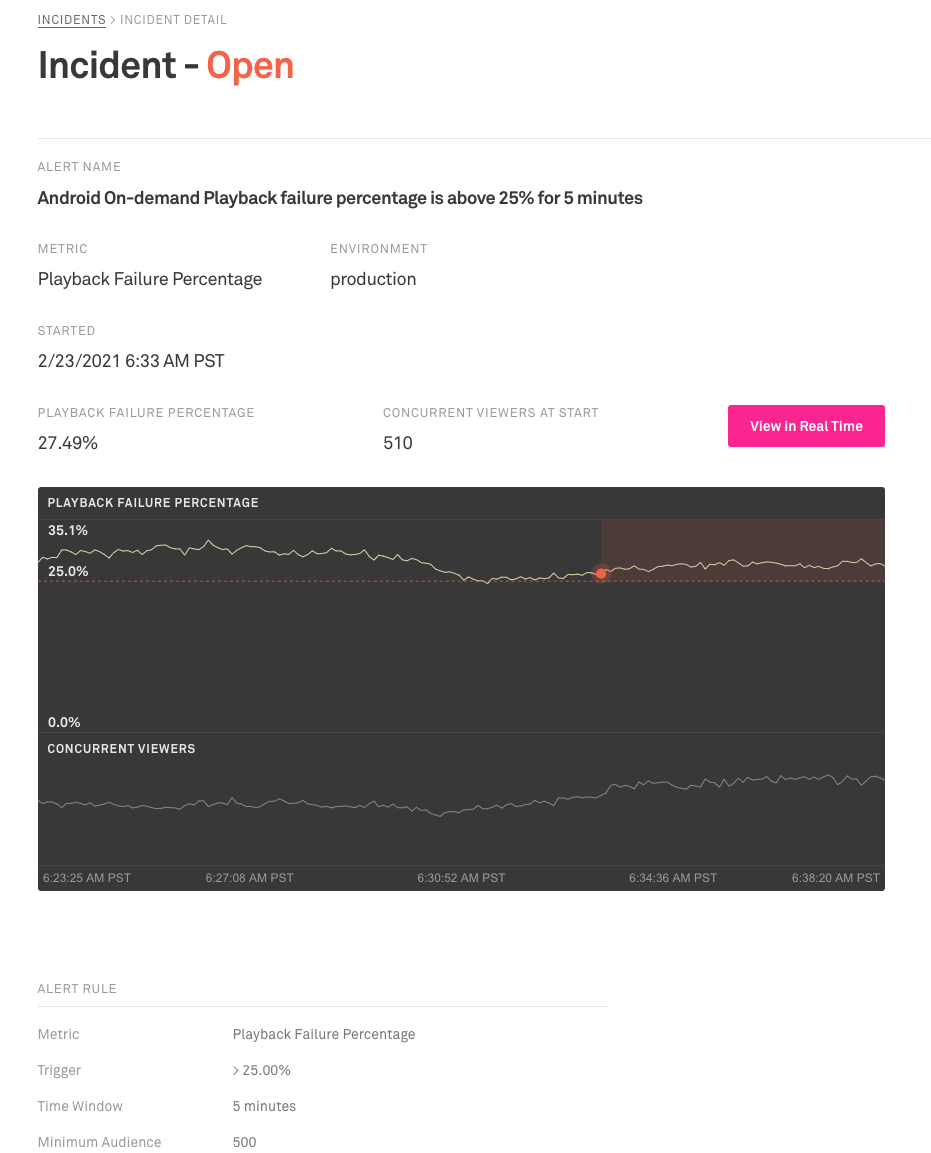
When an alert is triggered, the metric performance is captured in an Incident. The Incident page provides a place to see the characteristics of the alert and the metric behavior at start and end of the incident.

Incidents contain the following information:
Alert Name: Name for the alert as defined in the rule definition
Started: The timestamp when the metric first crossed over the threshold defined in the alert rule.
Ended: The timestamp when the metric first crossed out of the metric threshold defined in the alert rule.
Duration: The length of time the alert was firing, the time between the Started and End times.
[Metric] The value of the metric when the alert incident is triggered
At End: The value of the metric when the alert incident is resolved
Peak: The peak value of the metric while the alert is firing
Some data is only shown once an alert is closed such as the Closed time, Duration, etc.
Incident Start/Close Charts
Charts and additional details are captured in the Incident page when an alert incident is opened and closed.
Incident Start:
[Metric] The value of the metric when the alert incident is triggered
Concurrent Viewers: The number of viewers when the incident started.
In order to provide context on your video platform performance as the incident occurs, the chart shows up to 10 minutes before the incident starts and up to 5 minutes after the incident is opened. The lead-up time may be shorter than 10 minutes is the alert rule directly triggers an alert after it is saved.
Incident Close:
[Metric] The value of the metric when the alert incident is resolved
Concurrent Viewers: The number of viewers when the incident ended.
For post-mortem reviews, the performance of the metric is captured in a chart that shows up to 10 minutes as the incident is resolved and the next 5 minutes after it ends.
Incidents can be queried via the List Incidents APIAPI.
Note: If an incident is open when it's rule definition is modified, the incident will be automatically closed. Any configuration data about the incident, such the threshold value or filters applied will reflect the rule configuration as of when the incident is opened.
Notify your team
Mux Data can send notifications when alert incidents are opened and closed. Notifications are sent to channels that define the method and address of the services where the notifications should be delivered.
Channels are available for:
- Slack
- PagerDuty
Notification configuration can be found on the Alerts page in the "Notification Channels" tab. To setup a new channel, click the "Add Channel" button. From there you can choose the notification channel type, enter the destination address (email, Slack channel, or PagerDuty integration key).
You can choose what types of alerts are sent to each channel. Choose "Anomaly" If you only want to receive notification of alerts generated automatically by Mux Data, "Threshold" will be notified of alerts that are configured in the environment, and "All" will sent notifications for all alerts.