Smoothness
Smoothness is a score based on the amount of rebuffering that happened during a view.
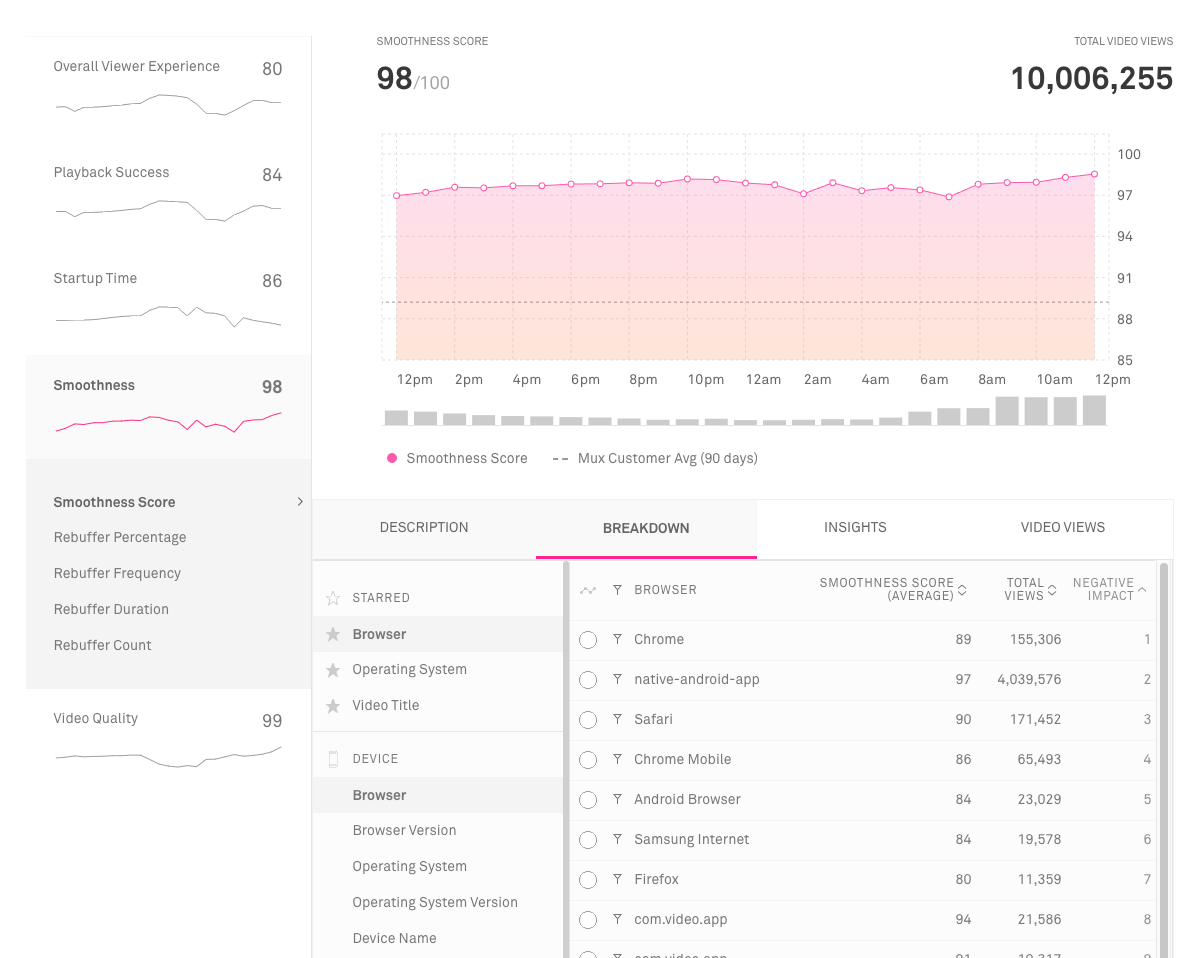
Smoothness Score
Smoothness Score measures the amount of rebuffering a viewer sees when watching video. A higher Smoothness Score means the viewer experiences less rebuffering, while a lower score means a viewer sees more rebuffering.
Formula
Average of:
and
Rebuffering can be measured as a combination of the number of rebuffering events and the rebuffering percentage. We measure rebuffering in both ways in order to account for views where rebuffering events are short but occur often. We consider multiple interruptions to be worse than a single interruption, even if total time spent rebuffering is the same. Averaging both measurements helps account for this, and provides a truer representation of the viewer experience.
Rebuffering time is measured as a percentage because a 5-second rebuffering duration is much more meaningful when viewing a 10-second clip versus a 2-hour movie. Our research shows that watch time rapidly decreases from just a single percentage point of rebuffering. We use an exponential curve to model this rapid initial decrease from rebuffering, which then slows down after a rebuffering percent of ~10%. This is because rebuffering is now high enough that incremental amounts of rebuffering becomes less impactful.
Rebuffering counts are slightly less negative under certain circumstances. For example, a single half-second rebuffering event during a long video might be barely noticeable. However, multiple rebuffering events do become noticeable and will rapidly decrease your score. This curve differs from the percentage curve in that a single rebuffering event is not harshly penalized. The score decreases rapidly in the 2 to 4 range, and then slows down past 5 rebuffering events due to the diminishing impact of additional events.
Both rebuffering percentage and rebuffering counts degrade the user experience, so we average the score. This helps balance for cases when either count or percentage is high while the other metric is low. A single rebuffering event of 1% isn’t great, but it’s better than 10 rebuffering events of 0.1%.
Note that EBVS views do not receive a Smoothness Score.
Examples:
- No rebuffering: 100
- 5 minute video with a single 5s rebuffer: average of 80 and 90 = 85
- 20 minute video with four 15s rebuffers: average of 44 and 60 = 54
Use this metric to:
- Understand how problems with rebuffering impact the overall viewer experience
- Compare rebuffering performance to other areas of viewer experience
- Find areas where rebuffering can be optimized and improved
Rebuffer Percentage
Rebuffer Percentage measures the volume of rebuffering that is occurring across the platform. Rebuffer Duration is the sum of the time viewers spend rebuffering on the platform or the given set of video views. Watch Time is the sum of all time viewers spend watching video, inclusive of rebuffering time. The Rebuffer Percentage then measures the rebuffer duration as a percentage of watch time.
Rebuffering occurs when the video stalls while a viewer is attempting to play through content, most often because it is taking more time to download (buffer) the content than it takes to play it. Stalls can also occur when a viewer attempts to seek to different times in the media, which is treated as a separate metric in Mux Data called Seek Latency.
Use this metric to:
- Understand how much time viewers spend waiting for videos to rebuffer
- Optimize an adaptive algorithm or rebuffering strategy
- Compare players and CDNs
Rebuffer Frequency
Rebuffer Frequency measures how often rebuffering events happen. It’s important to track this number because it can reveal issues of video stuttering, where the player is being too aggressive when restarting playback and has to frequently stop to rebuffer. This issue can be lost when measuring the rebuffering time, but can be just as frustrating as longer rebuffering events.
Rebuffering occurs when the video stalls while a viewer is attempting to play through content, most often because it is taking more time to download (buffer) the content than it takes to play it. Stalls can also occur when a viewer attempts to seek to different times in the media, which is treated as a separate metric in Mux Data called Seek Latency.
Use this metric to:
- Understand how frequently viewers are interrupted by rebuffering
- Optimize an adaptive algorithm or rebuffering strategy
- Compare players and CDNs
Rebuffer Duration
Rebuffer Duration is the amount of time in seconds that viewers wait for rebuffering per video view. Videos with longer durations have more opportunities for rebuffing events to occur and can make comparisons with shorter videos difficult, making Total Rebuffer Percentage the safer metric to optimize with. However Rebuffer Duration can be a useful metric for understanding the true viewer experience because it’s measured in seconds as opposed to a percentage.
Rebuffering occurs when the video stalls while a viewer is attempting to play through content, most often because it is taking more time to download (buffer) the content than it takes to play it. Stalls can also occur when a viewer attempts to seek to different times in the media, which is treated as a separate metric in Mux Data called Seek Latency.
Use this metric to:
- Understand how long viewers wait for videos to rebuffer per video view
- Optimize an adaptive algorithm or rebuffering strategy
Rebuffer Count
Rebuffer Count shows the number of rebuffering events that happen during video views. Compared to Total Rebuffer Frequency, Rebuffer Count can help you easily understand how many views are seeing more than zero rebuffering events.
Rebuffering occurs when the video stalls while a viewer is attempting to play through content, most often because it is taking more time to download (buffer) the content than it takes to play it. Stalls can also occur when a viewer attempts to seek to different times in the media, which is treated as a separate metric in Mux Data called Seek Latency.
Use this metric to:
- Understand how often viewers are interrupted by rebuffering per video view
- Optimize an adaptive algorithm or rebuffering strategy