Startup Time
Startup Time is the time between when the user attempts to start playback and when they see the first frame of video.
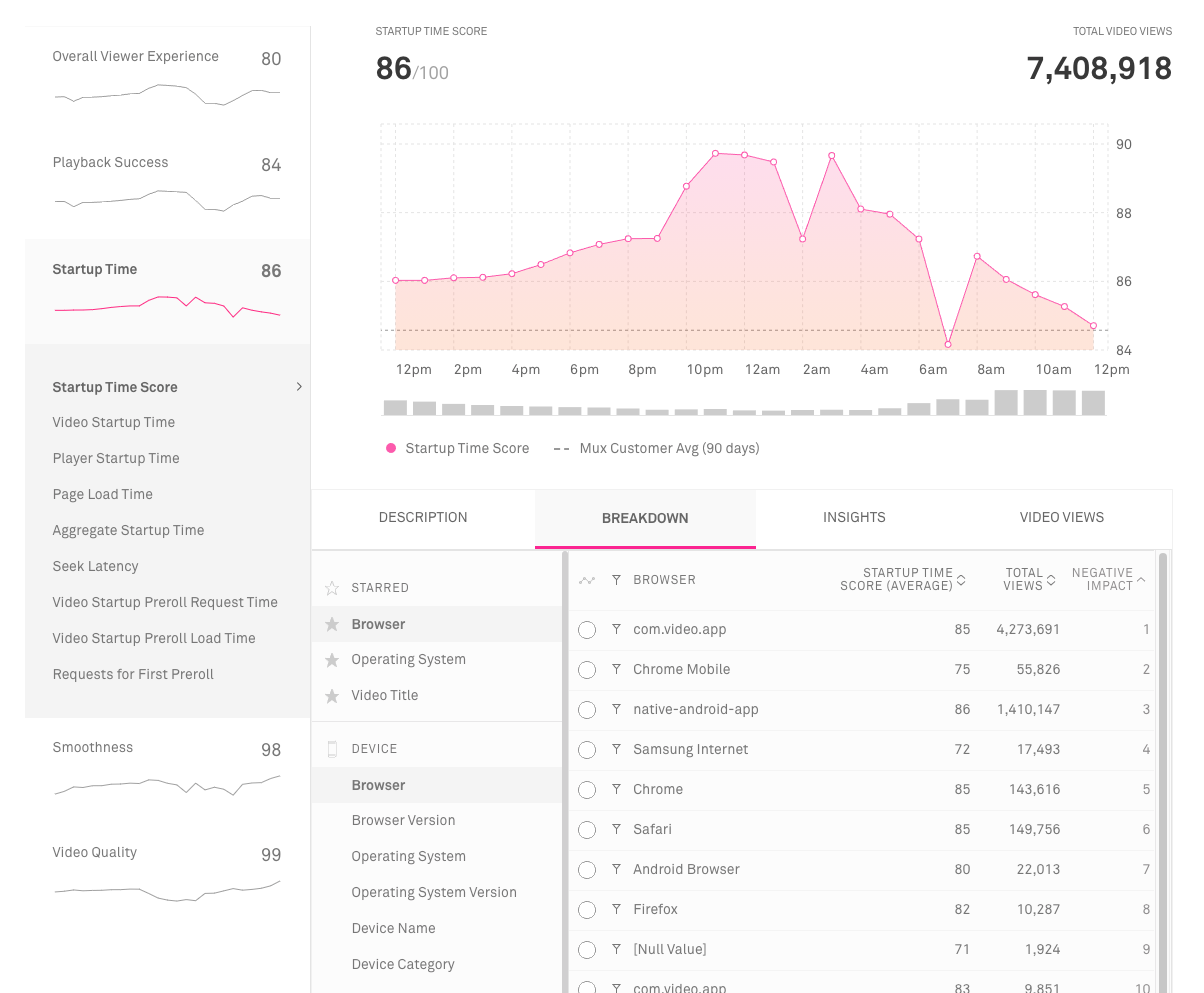
Startup Time Score
Startup Time Score describes how happy or unhappy viewers are with startup time. Longer startup times mean lower scores, while shorter startup times mean higher scores. Once startup time reaches a certain point (around 8 seconds), we begin to decrease the rate of score decay since additional seconds of startup becomes less impactful for long startup times.
Formula
This score decreases at a greater rate after 500ms of starting up.
Note that EBVS views do not receive a Startup Time Score.
Example values:
- 400 ms: 95
- 2 seconds: 80
- 8 seconds: 50
- 20 seconds: 29
Use this metric to:
- Understand how problems with startup time impact the overall viewer experience
- Compare startup time performance to other areas of viewer experience
- Find areas where startup time can be optimized and improved
Video Startup Time
Video Startup Time measures the time that the viewer waits for the video to play after the page is loaded and the player is ready. It specifically measures from when the player has been instructed to play the video, either directly by the user or via autoplay, to when the first frame of video is showing and the playhead is progressing. In the case that the player is configured with a pre-roll ad, Video Startup Time is the time until the first frame of the pre-roll ad is displayed.
Mux provides two percentiles of this metric:
- Median (50th Percentile) – Helps understand a typical experience (half are better than this number, half are worse)
- 95th Percentile – Helps understand what a poorer experience is like on your platform, while excluding outliers and happening frequently enough (1 in 20 views) to always be worth your attention.
Our data shows that viewers can be very impatient when waiting for a video to start, leaving in as little as two seconds for certain content types.
Network performance and initial rendition selection have the greatest impact on this number.
Preloading the video data before the viewer clicks play can also have a positive impact on this metric, however this should only be done when the video is the primary piece of content.
Player Startup Time
Player Startup Time measures the time from when the player is first initialized in the page to when it is ready to receive further instructions.
While Player Startup Time is usually low, it can point to subtle difference in the operations of players. When combined with Page Load Time and Video Startup Time we can see Aggregate Startup Time, and understand the full amount of time a viewer waits on a video watch page.
To get Player Startup Time data, you must pass player_init_time in your client integration.
Page Load Time
Page load time measures the time from the initial user request for a page to the time when the video player is first initialized. Use this metric to understand the impact of new page resources (JavaScript files, CSS, etc.) on the viewer wait time. This can also be used to compare video players, and the size and loading speed of their files impacts the wait time.
Page Load Time is only recorded for the first video view on a page, so you may see a smaller number of total views for this metric.
Aggregate Startup Time
Aggregate Startup Time combines Page Load Time, Player Startup Time, and Video Startup Time to show the total time a viewer waits for a video to play after requesting to watch the video on the previous screen or page.
On the web we often have web pages that are dedicated to individual videos. These pages are referred to as watch pages (e.g. mydomain.com/watch?video=1234). Viewers get to these pages by clicking on search results and lists of video thumbnails. In the case of watch pages we need to not only understand the Video Startup Time, but the full time that the viewer waited from when they clicked/tapped to watch the video.
Use this metric to optimize your watch pages for shorter wait times. For example, waiting to load secondary content (comments, related videos) until the video is playing, or choosing a video player that has the lowest impact on aggregate startup time.
This metric is only recorded for the first video view on a page, so you may see lower total view counts represented in this metric.
Seek Latency
The Seek Latency metric measures the average amount of time that viewers wait for the video to start playing again after seeking to a new time. Seeking is any time the player is asked to jump backward or forward to a new time in the video, outside of normal playback. Aside from the viewer clicking on the progress bar, seeking can also happen programmatically, for example when jumping ahead to resume where the viewer previously stopped watching.
Use this metric to:
- Look for cases of extreme seek startup times
- Compare video players and their ability to respond quickly to a viewer’s seek request
Video Startup Preroll Request Time
The Video Startup Preroll Request Time measures the total amount of Video Startup Time that is spent making ad requests, waiting for the ad responses, and parsing the VAST/VMAP response. Specifically, his measures the amount of time the viewer is waiting for the video to start in which the player does not yet know which ad to play, if any.
It is important to call out that this time only includes time during video startup (i.e. after the user initiates playback, or auto-play does). Any time spent requesting ads before playback is initiated is not included in this metric.
Use this metric to:
- Understand the performance of your ad server as it affects video startup time
- Attribute slow startup times to ad network performance, versus ad asset performance
Video Startup Preroll Load Time
The Video Startup Preroll Load Time measures the total amount of Video Startup Time that is spent loading the first preroll ad asset. Specifically, this measures the amount of time the viewer is waiting for the first preroll ad to start playing after all ad responses have been received and parsed.
It is important to call out that this time only includes time during video startup (i.e. after the user initiates playback, or auto-play does). Any time spent preloading the ad asset before playback is initiated is not included in this metric.
Use this metric to:
- Understand the performance of your ad asset delivery as it affect video startup time
- Attribute slow startup times to ad asset performance, versus ad network performance
Requests for First Preroll
This metric measures the number of ad requests that are made up to the point of preroll ad playback beginning. Depending on your ad architecture, it is possible that your player may make sequential ad requests in the case that the previous request returned no playable ad in order to fill all possible impressions. In this case, multiple ad requests can lead to slow startup times, which can potentially be improved by reducing the possible waterfall/fallback calls, ensuring playable ads being returned in the first request, or other means within your ad server.
Use this metric to:
- Understand performance correlation with the number of ad requests made to retrieve the first playable ad